
-
Biostatistics at the Nighthawk's Nest
We don't know what we don't know.
The Scientific Method is at the heart of everything we do at Nighthawk Biotechnology-Next Generation. Our goal is to test a priori hypotheses, and to use empirically-derived data to test the appropriate predictions that follow from those hypotheses, yielding support or lack of support until left with an apparent answer to our research question. Students are taught this philosophy beginning in 9th grade, and culminating with the Independent Projects they conduct as students in Bioscience II or Bioscience-Internship.
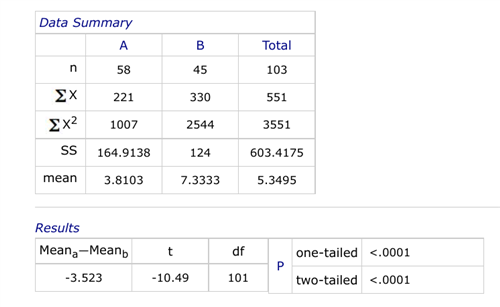
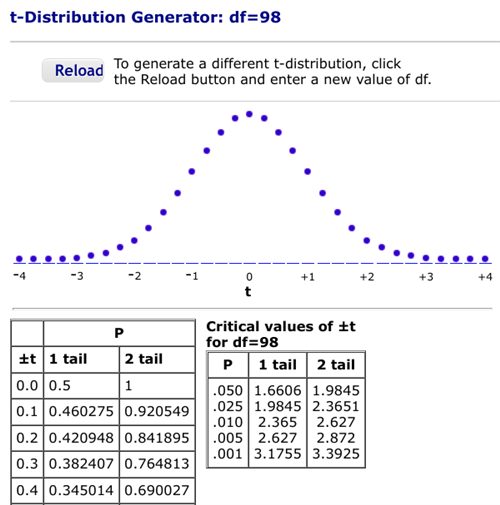
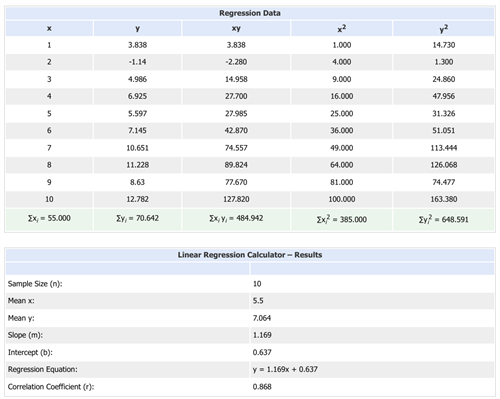
Learning the field of biostatistics is therefore an important part of our approach. With proper knowledge of statistics, students know the difference between an anecdotal test of their prediction and a quantifiable one. Further, they understand whether differences between testing groups are statistically significant--meaningful enough to state that their hypothesis is indeed supported. We also focus on experimental design (e.g., proper controls and constants, setting up independent variables, double-blind trials for vaccines, etc.) so that students can evaluate whether other variables are effecting their result besides the independent variable that they predicted to be the predominant influence on the patterns they see. By the conclusion of Bioscience II, students have conducted t-tests, ANOVA, R-squared and regression analysis, and chi-square tests. Depending on the subject of their independent project (or if the data they acquire demands a different set of statistical tests due to lack of a parameter called "normal distribution"), some students learn other statistical procedures.
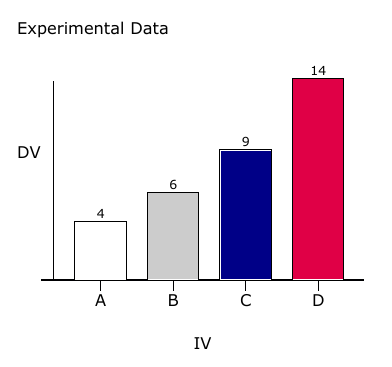
Students at Nighthawk Biotechnology-Next Generation undergo rigorous training in presenting results, especially during the course of completing their Independent Projects (which they can later submit for competition at a local Science Fair such as SARSEF). Students are taught how to use various graph-makers, such as those located on VassarStats and Good Calculators.
...
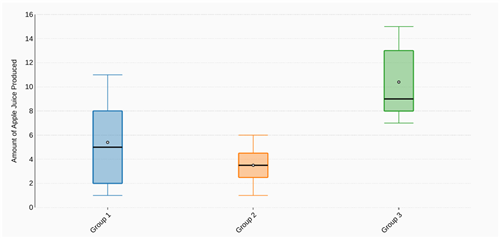
After students generate graphical representations showing the distribution of their data, they test for differences between their testing groups to see if the change they introduced during the experiment led to their predicted result at a threshold considered significant by the scientific standard (P < 0.05).
Students compare their results against models that create random distributions of possible results to see if the differences they see between testing groups are significantly greater than chance alone.
Students also evaluate how a trend occurs over time, testing to see if the "trend" really does occur more than chance would predict.
Sometimes the prairie dogs (Betty and Reggy) get into the action as well.
"Betty" and "Reggy" want you to come be a part of something special at Nighthawk Biotechnology-Next Generation.
We are the future. And the future is now.
And...we have awesome stickers.
#nighthawkbiotechnextgen
Select a School...
Select a School
- Amphi Academy Online School
- Amphitheater High School
- Amphitheater Middle School
- Canyon del Oro High School
- Copper Creek Elementary School
- Coronado K-8 School
- Cross Middle School
- Donaldson Elementary School
- Harelson Elementary School
- Holaway Elementary School
- Innovation Academy
- Ironwood Ridge High School
- Keeling Elementary School
- La Cima Middle School
- Mesa Verde Elementary School
- Nash Elementary School
- Painted Sky Elementary School
- Prince Elementary School
- Rillito Center
- Rio Vista Elementary School
- Walker Elementary School
- Wilson K-8 School